
Currently the news about unemployment in India touching a “45 years high” has been circulating in print and electronic media. The news was also picked up by foreign media and appeared across many publications in USA, Europe and Middle East.
However, the NSSO report requires a more nuanced analysis than just a sensational headline. Before comparing the outcome of this survey with any data points in the past, the following additional parameters should be taken into consideration.
New methodology / New sampling criteria
Till 2012, jobs data was based on Employment Unemployment Survey (EUS) which was conducted once every 5 years. After 2016, jobs data are now based on Periodic Labor Force Survey (PLFS) which measures quarterly changes in labor market.
In EUS 2011-12, households for survey were selected based on levels of livelihood (rural) and expenditure (urban). However, in PLFS 2017-18, households for survey were selected based on the levels of education.
Issues with the new sampling technique
There are two issues with this basis of sampling.
First, the sample selection impacts the outcome. In statistics, samples need to be random. It is discouraged to select a sample based on a criterion that itself affects the behavior that one is trying to explain.
To illustrate through a crude analogy, let’s consider a survey for election results. For this the surveyors select “households with number of family members that support AAP” with 0, 1, 2+ members as 25%, 50% and 25% weightage respectively.
This would ensure that sample of households where no one supports AAP (0 option) gets only 25% representation, whereas supporters (1 or 2+) get 75% weightage. This survey would predict good support for AAP, but it may not be the ground reality because of the inherent problem with sample selection criteria that directly impact the outcome.
Similarly, Education level directly affects labor market participation hence the outcome of survey is expected to be skewed.
Secondly, sample weightage is not aligned with ground realities.
In India, the number of households where NO ONE in the family has attained secondary level education is 75% (for rural) and 46% (for urban). However, in NSSO survey sample, only 25% of selected households represent low education.
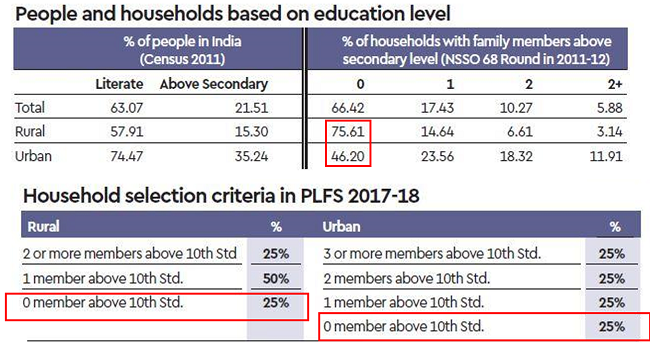
Effectively, people with lower levels of education who comprise a much larger section of actual workforce (66%) have been grossly under-represented (25%) in the survey sample.
Impact of the new sampling technique
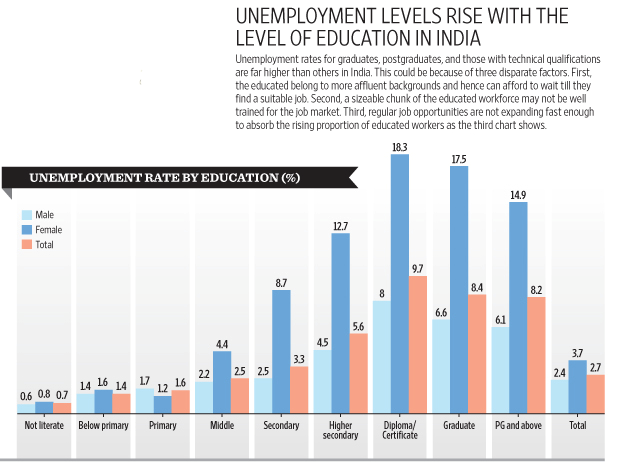
In India, joblessness rises with education level.
The data from 2011 census shows that unemployment numbers are higher for people with higher education (15%) compared to those with lower education (8%).
A report by World Economic Forum (WEF) also showed similar trend. Unemployment was more than 8% for graduates and post graduates. It was only 1% for people with less than primary education.
The reason for this phenomenon is explained by the fact that in India, 90% of the jobs are in unorganized sector like construction, daily wage workers, taxi drivers, small time retailers, casual contract workers and self-employed professionals. Less educated section of the workforce is more likely to take up such jobs. Consequently, the higher the education level attained, the more people are unemployed.
Either NSSO should not have used education level as the criterion for sample (because education level directly impacts the outcome of unemployment data) or the sample sizes should have been inline with the population data.
Since NSSO survey includes more households with higher education, unemployment data is showing a sudden jump.
Other prominent inaccuracies in the data
The report indicates that in the last six years, unemployment suddenly increased from 2.1% to 6.1% (a “45 years high”).
At the same time, the report also indicates that in the last six years, India’s population has decreased by 1.3% and is now at just a little over 1 billion. Urbanization has also decreased by 5.8%.
Both these are incorrect because in reality, both the population and urbanization have been constantly increasing. Per census, India’s population is estimated at 1.3 billion (not 1.074 billion). These counter intuitive outcomes indicate to some structural fault with method / data which is yielding unreliable outcomes.
Is unemployment really at 45 year high?
In India, jobs data is published by multiple agencies / sources including –
- NSSO survey data (once every 5 years)
- Labor Bureau Reports
- CMIE (Centre for Monitoring Indian Economy), a non-govt agency that publishes monthly data
- United Nations ILO (International Labor Organization) Reports
- EPFO publishes monthly data on subscriber additions
- CII (Confederation of Indian Industry) data from Industry
Of these, CII estimates that MSME industries created 14 million jobs every year in last four years. As per United Nations ILO’s ‘World Employment and Social Outlook: Trends 2018’ report, from 2016 to 2019 unemployment in India remained largely at the same 3.4% to 3.5% level.
Different agencies use different methods and arrive at different data points for unemployment in India. PLFS has been used for the first time and it is unfair to compare its outcome (6.1%) with any other data point in the past.
Still if one were to persist in apples to oranges comparison, it must be noted that as per the last census in 2011, unemployment at every segment of workforce varied from 7% to 15%. Overall unemployment was as high as 9.6%.
If unemployment in 2011 was 9.6%, then it is definitely inaccurate to claim that at 6.1% unemployment in 2018 is at 45 years high.
Summary:
Yes, India needs a relentless focus on job creation. Almost 5 million Indians are entering work force every year and India needs to constantly create new jobs. Specifically, India needs to create high quality and higher paying jobs in the formal organized sector which is where the higher educated workforce can make bigger contribution to the economy.
India also needs to increase education attainment levels. Forbes indicates that India is creating millions of high skilled jobs, but many are not finding enough skilled workers.
Yet, 6.1% unemployment in India is not an earth-shattering number by itself. A look at currently world’s Top 15 economies indicates that unemployment in France, Italy, Brazil and Spain is at 8%, 10%, 12% and 14% respectively. These are high but not enough to start ringing alarm bells.
All in all, even at 6.1% as measured by the new methodology, unemployment in India is NOT at “45 years high”. That’s a meaningless exaggeration without any basis in facts or data.
