
India has witnessed a dramatic shift in intra-household resource allocation, leading to a significant reduction in poverty among children and adult females between 2011-12 and 2023-24. In a groundbreaking study published in the Economic & Political Weekly on 9th August 2025, economists Shamika Ravi and Mudit Kapoor analyzed various factors which have led to a remarkable decline in poverty rates for children and women.
The EPW article headlined “Intra-household Resource Allocation and Changes in Child and Gender Poverty between 2011–12 and 2023–24” states that while most poverty estimates based on household consumption surveys assume equal distribution of resources among household member, this study relaxed this assumption by using household expenditure data on privately assignable items to estimate resources allocated to children (0–14 years), adult females, and adult males (15–79 years).
#NewPublication 'Intra-household Resource Allocation and Changes in Child and Gender Poverty between 2011–12 and 2023–24' (with @muditkapoor). The paper computes the comprehensive evolution of poverty outcomes:
— Prof. Shamika Ravi (@ShamikaRavi) August 11, 2025
(i) Poverty rate
(ii) Poverty gap
(iii) Poverty upliftment
The… pic.twitter.com/E51Lhe40BZ
Historically, gender imbalance and bias has been observed in household consumption surveys. The EPW paper points out that if resource allocation within the household is skewed, there is always a possibility that some household members are poor while others are not.
Given the focus of the Modi government on inclusive and women-led development, the paper authored by Shamika Ravi and Mudit Kapoor, delves in to the changes in intra-house allocations, particularly towards women and children, and their impact on the changing nature of the poverty distribution among men, women, and children.
Notably, the study, relies on the data of Household Consumption Expenditure Survey (HCES) for 2011-12 and 2023-24, conducted by the Ministry of Statistics and Programme Implementation (MoSPI).
The researchers employed a sophisticated econometric model, building on prior work by Dunbar et al. (2013) and Calvi (2020), to estimate resource shares “using Engel curves and non-linear regression techniques.”
Share of adult females in household resources increased drastically in over a decade
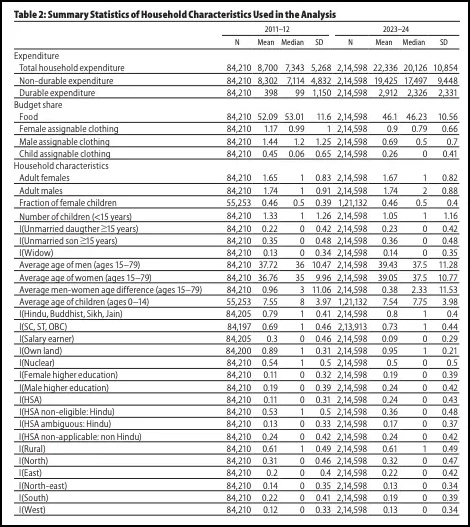
While analysing the coefficient on the estimates of adult females’ share in household resources, a measure of their bargaining power, the research found that the share of household resources to adult females was positively associated with the number of adult females, higher the fraction of female children (for households with children) if the leading woman in the household was eligible for inheritance in ancestral property, if the household belonged to either Scheduled Caste (SC), Scheduled Tribe (ST) or Other backward Classes (OBC), and if there was a college-educated female or male member in the household.
It was also found that the resource share of adult females was negatively associated with the number of adult males and the presence of widows in the household with children.
“Interestingly, for 2011–12, adult females in Hindu, Buddhist, Jain, and Sikh households were negatively impacted compared to those who did not belong to these religions. However, in 2023–24, the reverse was true. Compared to the urban areas, adult females in rural areas had a lower share of household resources,” the research paper reads.
The paper states that in contrast to the western states, adult females in northern, eastern, and southern states had lower share in household resources. Meanwhile, adult females in the north-eastern region had a higher share of household resources.
Analysing the share of adult females in household resources across the average age of adult women (15 to 79 years) in the household, the authors found that the estimated share of adult females in household resources varies significantly across age and also if the households had children (0 to 14 years).
For the years 2011-12, the estimated share of adult females in household resources is typically below the equality line, only for urban households without children, in the average age group of 20 to 30 years and for urban households with children, in the average age group of 45 to 55 years, it is slightly above the equality line (50%), as seen in the point density graphs. The equality line here indicates equal resource distribution.
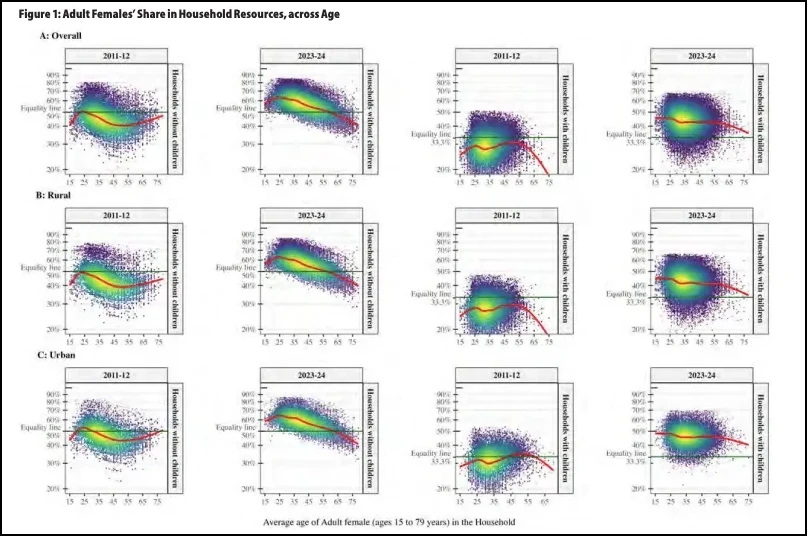
These density graphs visualise the data with a smoothed-trend line (bold in greyscale, red online), to highlight the relationship between resource shares and age, with pale-yellow (or darker greyscale) areas indicating higher data point concentrations, the report mentions.
The 2011-12 data indicates a generally much-lower household resource share for adult females across all age groups with or without children. The graphs show that the share is slightly above the equality line, for urban households with children in the 45-55 age group. These numbers indicate limited instances where women received a higher-than-equal share.
A similar trend is seen in the case of households without children. The household resource share of adult females is below the equality line for most age groups, except for urban households in the age range of 20-30. In this age range, adult female household resource share marginally exceeds equality. The figures for 2011-12 indicate that adult females generally had lower bargaining power compared to adult males, with “resource allocation skewed against them.”
In contrast, the adult female household resource shares after over a decade, 2023-24, witnessed a notable shift. In house with children, adult females in 2023-24 received a higher-than-equal share of household resources, reflecting a remarkable increase in their bargaining power relative to adult males.
Meanwhile, in household without children, this trend is even more pronounced in rural and urban areas. The density graphs indicate that for rural households, the smoothed-trend line is above the equality line for adult females aged 15–55 years. For urban households, it extends to ages 15–65 years, indicating a broader age range where women command a higher household resource share compared to 2011–12.
The consistent elevation smoothed trend line across age groups by 2023-24 reflects a more uniform improvement in resource allocation to women, especially in. households with children. In fact, presence of children seems to influence resource allocation dynamics. In 2023-24, households with children registered a more notable pivot toward higher female household resource shares. It can interpreted as increased prioritisation of resources toward family units where women have a central role. These positive numbers reflect a broader societal and policy-driven empowerment of women.
27 crore people lifted out of poverty between 2011-12 and 2023-24
In the next section, the paper focuses on poverty across the states and union territories. “We present three sets of results: (i) poverty rate, which measures the proportion of poor people; (ii) poverty gap, which measures for a poor person the difference between the poverty line and the expenditure as a percentage of the poverty line, a measure of poverty intensity; (iii) poverty upliftment, which measure the absolute number of people that have been lifted out of poverty between 2011–12 and 2023–24,” the report reads.
“We provide estimates of poverty rate, poverty intensity, and poverty upliftment, (i) when household resources are assumed to be equally distributed among household members, rural and urban poverty line for each state/union territory for 2023–24,” it adds.
The analysis, based on Rangarajan poverty line, estimates that more than 27 crore people were lifted out of poverty over the last decade, with 15.6 crore children and 12.3 crore adult females accounting for the majority. However, the number of poor adult males surged by nearly 0.36 crore due to slower poverty reduction relative to population increase.
Bihar and West Bengal registered a remarkable decline in poverty
For poverty rates where the researchers assumed the household resources are equally distributed, it was found that at all-India levels, poverty rates have declined from 29.5% in 2011–12 to 4% in 2023–24.
The EPW report highlights that in the eastern region of Bihar, pverty declined from 41.3% in 2011–12 to 4.4%, while in West Bengal, the poverty rate was lower at 30.4% in 2011–12 as compared to Bihar, and it declined to 6% in 2023–24 which was higher than what was observed for Bihar. In Uttar Pradesh, the poverty rate fell from 40% in 2011–12 to 3.5% in 2023–24.
“However, when we account for intra-household allocation of resources, which allows for household resources to be unequally distributed across members, we found that poverty rates in 2011–12 and 2023–24 were typically higher than when we assumed equal sharing of household resources,” the report reads.
Despite the unequal sharing of household resources, the researchers Professor Shamika Ravi and Mudit Kapoor point out that poverty rates have declined between 2011–12 and 2023–24. For example, at the all-India levels, the poverty rate in 2011–12 was 34.7%, while in 2023–24, it was 10.5%, a decline of almost 15 percentage points. The decrease in poverty rate was observed across all the states.
The report also highlights the inequality in poverty rates across children, adult females, and adult males. In 2011–12, the overall poverty with unequal sharing of households was 34.7%; however, for children, it was 58.3%; for adult females, it was 33.3%; and for adult males, it was the lowest at 15.1%. This pattern was seen across all states of India except for the north-east states. In northeast states, poverty among adult males was higher than poverty among adult females and children. In Rajasthan, the overall poverty with unequal shares in household resources was 31.2%; however, for children, it was 57.8%; for adult females, it was 28.9%, while for adult males it was 5.5%, the report estimates.
“By 2023–24, we see a remarkable decline in poverty among adult females and children,” the paper states.
The key findings of the research show that in 2011–12, poverty rates were starkly unequal: 58.3% for children, 33.3% for adult females, and 15.1% for adult males. However, by 2023–24, these figures slumped significantly to 17.8% for children and 2.2% for adult females.
Meanwhile, adult male poverty marginally declined to 13.5%. This significant shift reflects a reallocation of household resources toward women and children, attributed to enhanced female bargaining power.
“Based on these results, it could be argued that the substantial decline in poverty between 2011–12 and 2023–24 is primarily driven by poverty reduction among adult females and children,” the report states.
The authors of this EPW paper, however, noticed some variations across states. In Chhattisgarh, a substantial decline in poverty rate among adult females from 50.7% to 4.3% between 2011–12 and 2023–24. However, it reduced marginally for children, from 68.2% to 54.7%, and for adult males, it marginally increased from 25.1% to 25.5% during the same period.
In Uttar Pradesh, during the same period, poverty among children declined from 72.2% to 11.1%; for adult females, it decreased from 42.4% to 2.3%; for adult males, it increased marginally from 13.3% to 13.6%.
“For adult males between 2011–12 and 2023–24, we observed a significant decline in poverty rates in Odisha from 24.1% to 13.7%, Tamil Nadu from 13.9% to 2.8%, and Tripura from 51.1% to 25.1%,” the report reads.
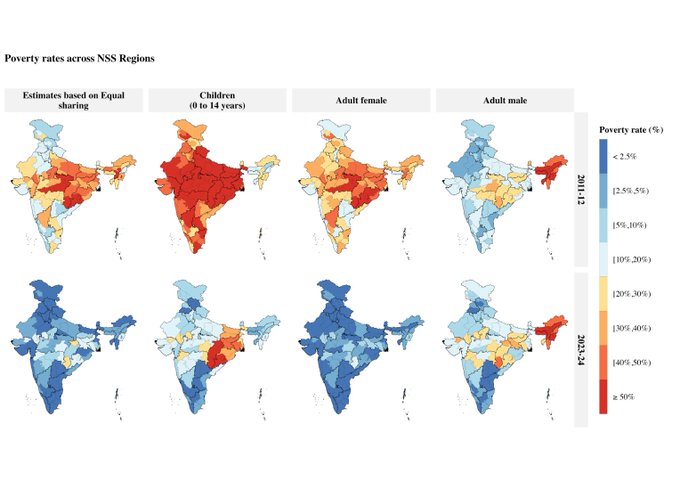
In the National Service Scheme (NSS) regions, with equal sharing of household resources, a significant decline in poverty across all areas was noted. Across most of the NSS regions, poverty rates among children were the highest in 2011–12, followed by poverty rates among adult females, while it was typically lower for adult males.
However, the report found that by 2023-24, poverty among children and adult females declined sharply, although poverty in the eastern states of Chhattisgarh, Jharkhand, Bihar, Odisha, and West Bengal remains high. “We also observed a significantly higher poverty level among adult males in north-east states, Chhattisgarh, Jharkhand, and parts of Bihar, Madhya Pradesh (MP), Maharashtra, and West Bengal,” the research paper states.
Poverty gap comes down from 18.4% in 2011-12 to 10.2% in 2023-24, Bihar’s adult female poverty gap dropped to unbelievable low
In its analysis of poverty gap, which is a measure of the shortfall of expenditure below poverty line, the study found that it was higher when accounting for unequal household resource allocation compared to equal sharing assumptions.
In 2011–12, with equal sharing of household resources, the research estimated the poverty gap at the all-India level to be an average of 18.4%, but 35.6% for children, 21.5% for adult females, and 13.5% for adult males (unequal sharing).
By 2023-24, however, the gap reduced to 10.2% (equal sharing), 17.9% for children and 6.4% for adult females, while adult males witnessed a slight increase to 15.1%.
The researchers observed variations in these numbers across states, with most notable variation being in Bihar, where adult female poverty gap dropped from 23.4% to 4.8%.
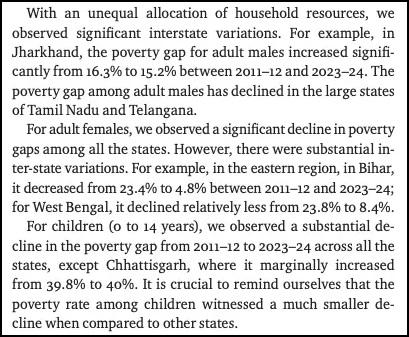
The study found that for adult females across all the NSS regions, poverty has reduced significantly between 2011–12 and 2023–24. It also observed that children’s poverty gaps were considerably higher in the eastern states of Chhattisgarh, Jharkhand, Bihar, Odisha, and West Bengal than in other NSS regions.
In north-east states, poverty gap for adult males “worsened”. In regions of Bihar, West Bengal, Chhattisgarh, Jharkhand, Gujarat, MP, Maharashtra and Odisha the numbers increased.
Poverty upliftment tells a success story, though challenges remain
The study proceeds to analysing poverty upliftment. The researchers define poverty upliftment as “Poverty Upliftment 2011–12 to 2023–24=Poverty Rate2011–12×Population2011–Poverty rate2023–24×Projected Population2021.”
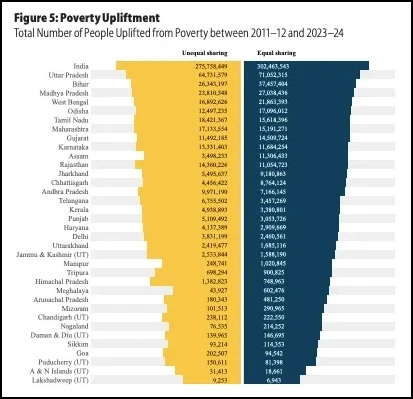
The research estimates that between 2011-12 and 2023-24, 27.58 crore people were lifted out of poverty in Indian households with unequal resource allocation, compared to 30.24 crore assuming equal sharing.
Researchers point out that this upliftment is driven by 15.61 crore children and 12.32 crore adult females, although the number of poor adult males increased by 0.35 crore due to slower poverty reduction relative to population growth.
The study highlight various across state including, Uttar Pradesh where 6.47 crore people (mostly women and children) were pulled out of poverty, Rajasthan, where .44 crore, with 1.08 crore children and 0.54 crore women, with Chhattisgarh registering marginal child poverty reduction, Madhya Pradesh 2,38,10,548, Bihar 2,63,43,197, West Bengal 1,68,92,626.
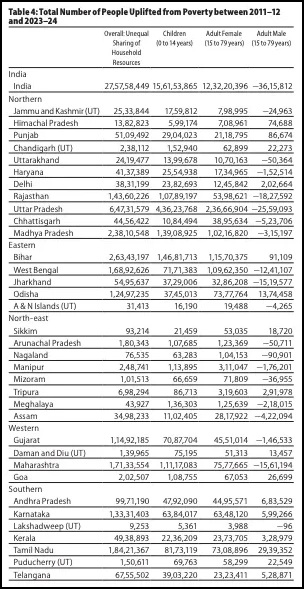
“When resources are equally shared, our estimates of poverty rates, which are based on the Rangarajan poverty line, indicate that 30,24,63,543 people were lifted out of poverty between 2011–12 and 2023–24. However, when we account for the unequal allocation of household resources, which typically results in higher poverty rates, 27,57,58,449 people were lifted out of poverty,” the report reads.
“We also observe that, with unequal resource allocation across the household, the entire poverty upliftment is on the account of children and adult females. We estimated that 15,61,53,865 children and 12,32,20,396 adult females, were lifted out of poverty from 2011–12 to 2023–24. However, for adult males, the absolute number of poor has increased by 36,15,812. This is primarily because the reduction in poverty rates among adult males has been lower than the population growth of adult males during the same period,” it adds.
By 2023-24, however, there has been a significant shift in household resources away from adult males to adult females and children, as a result of which children’s poverty rate fell to 12.6% and that of adult females declined to 2.8%; however, for men, it increased to 10.9%. As a result, Rajasthan witnessed a poverty upliftment for 1,07,89,197 children and 53,98,621 adult females, while for adult males, it increased by 18,27,592.
“This example illustrates that a large part of poverty upliftment is perhaps an outcome of improvements in the bargaining position of women, which has resulted in significantly higher allocation of household resources towards women and children and away from men,” the study notes.
The study broadly attributes Modi government’s initiatives like the Pradhan Mantri Awas Yojana and MUDRA Scheme, Lakhpati Didi Yojana, as these initiatives have prioritised women’s financial independence and property co-ownership. In April this year, as MUDRA Yojana completed 10 years, OpIndia reported that under this scheme, 52 crore loan account openings were facilitated, with nearly 70% beneficiaries being women.
“These programmes highlight the intention of the government to empower women. Prime Minister Modi, repeatedly in his vision for India to become a developed nation by 2047, has emphasised the role of women in leading this development effort,” the study highlights.
In conclusion, the authors of the EPW study summed up the transformational impact of Modi era. It points out that across rural and urban areas in most states and union territories, on average, the resource share of adult females was significantly lower than that of adult males in 2011–12.
By 2023–24, the situation had “reversed” as across all states and UTs, on average, the estimated resource share of adult females was greater than that of adult males. This dramatic shift in women’s bargaining power has resulted in the massive decline in poverty between 2011–12 and 2023–24 is concentrated in adult females and children, with a modest decline for adult males.
“Our estimates reveal that, on average, adult female poverty is lower than adult male poverty across all states and union territories in 2023–24, while in 2011–12, it was the opposite. These results are evidence of significant gains in women’s empowerment in the last decade,” the research paper concludes.
