

Beating global economic uncertainties due to ongoing geopolitical issues, India’s Gross Domestic Product (GDP) grew by 7.8% in the first quarter (April to June) of the financial year 2026-27. PM Modi called the exemplary growth a herculean feat, saying that “the collective strength of our people ensured India delivered such growth despite oil price shocks and supply chain issues in the midst of global uncertainties.”
However, the 7.8% figure also became the subject of intense political and economic debate. Usual suspects, including critics and opposition leaders, questioned the credibility of these numbers, pointing to downward revisions in previous data and certain statistical anomalies—like how manufacturing inflation seemed to fall while everyone knows costs are rising.
To put an end to the confusion, the Ministry of Statistics and Programme Implementation (MoSPI) released a detailed set of Frequently Asked Questions (FAQs) explaining the complex mathematics behind the numbers. If you have been reading the news and feeling lost in a sea of financial jargon like “double deflation,” “base year revision,” and “implicit deflators,” this article is for you. We will break down exactly what the government said, explain the technical terms in plain Indian English, and unravel why the 7.8% GDP growth is calculated the way it is.
What the numbers say
According to the government estimates, real GDP, or GDP at Constant Prices, is estimated at ₹81.36 lakh crore in Q1 FY 2026-27. It recorded 7.8% rise, compared with 6.9% growth in Q1 FY 2025-26. On the other hand, nominal GDP, or GDP at Current Prices, is estimated at ₹88.27 lakh crore, registering 10.3% rise, compared with 8.1% last year.
Real Gross Value Added (GVA) for the same period has been estimated at ₹73.82 lakh crore, recording 8.2% growth. The Nominal GVA is estimated at ₹80.53 lakh crore, recording 11.5% growth.
In the first quarter of FY 2026-27, manufacturing recorded 9.2% growth in terms of GVA, supported by strong output across key segments. Capital goods production also increased by 15.2%. The secondary sector expanded by 8.6% in Q1 2026-27, compared with 6.1% in the corresponding quarter of the previous year. The tertiary sector grew by 10.0% in Q1 2026-27, up from 8.0% in Q1 2025-26. Within the sector, financial, real estate, IT and professional services recorded 12.1% growth.
The new estimates also revised the real GDP growth for the previous 3 years. Accordingly, the GDP grew by 7.3% in 2023-24, by 7.2% in 2024-25, and by 7.7% in the FY 2025-26. Each of these numbers represent upward revision by 0.1%. The annual revised estimates reflect the use of new price and production indices with base year 2022-23. This includes the Output Producer Price Index (PPI) and Banking Services Price Index (BkSPI). Updated administrative data from different sources were also incorporated, the govt said.
Understanding the Basics: A Guide to Economic Terms
Before diving into the controversies and the government’s defence, we must first understand the basic building blocks of economic measurement.
What is GDP?
Gross Domestic Product (GDP) is simply the total monetary value of all the finished goods and services produced within India’s borders in a specific time period, like a quarter of a year. Imagine India as one giant factory. Everything this factory produces, from the cars manufactured in Chennai to the IT services delivered from Bengaluru, and the wheat grown in Punjab to tea grown in Assam, everything adds up to form the GDP.
What is GVA
While GDP measures the final value paid by the consumer (which includes taxes), GVA (Gross Value Added) looks at the economy from the producer’s side. GVA is the value of output minus the value of intermediate consumption, which is the raw materials used to make the product.
For example, if a baker buys flour, sugar, and butter for ₹50 and sells a cake for ₹150, the GVA is ₹100. It measures the actual “value added” by the baker’s physical and intellectual effort.
Nominal vs. Real GDP
This is where many people get confused, and it sits at the heart of the recent debate.
- Nominal GDP calculates the value of goods and services using current prices, the prices at the exact time they were produced.
- Real GDP calculates the value of goods and services using the prices of a fixed base year. This removes the illusion of growth caused merely by rising prices, which is inflation.
For example, a farmer sells 100 apples in 2025 at ₹10 each. The revenue is ₹1,000. In 2026, he sells the exact same 100 apples, but because of inflation, the price is now ₹15. His revenue is ₹1,500. A nominal calculation says the business grew by 50%. But a real calculation, using 2025 as the fixed base year price, says he still only sold 100 apples, so the GDP will remain ₹1,000. Therefore, the real growth will be 0%. Real GDP reflects the actual increase in physical production, which is a truer measure of a country’s economic health.
What is a Base Year
A base year is a reference point used to compare economic performance over time. Because the economy constantly evolves—new industries emerge, consumer habits change, and old technologies die—the base year must be updated periodically so that the yardstick remains relevant. India recently updated its GDP base year from 2011-12 to 2022-23.
What is a Deflator
A deflator is the mathematical tool used to strip out the effect of inflation from Nominal GDP to arrive at Real GDP. It essentially “deflates” the inflated current prices back to the base year’s reality.
The controversy of the revised base year and past GDP figures
The Allegation: Was last year’s GDP “shrunk” on purpose?
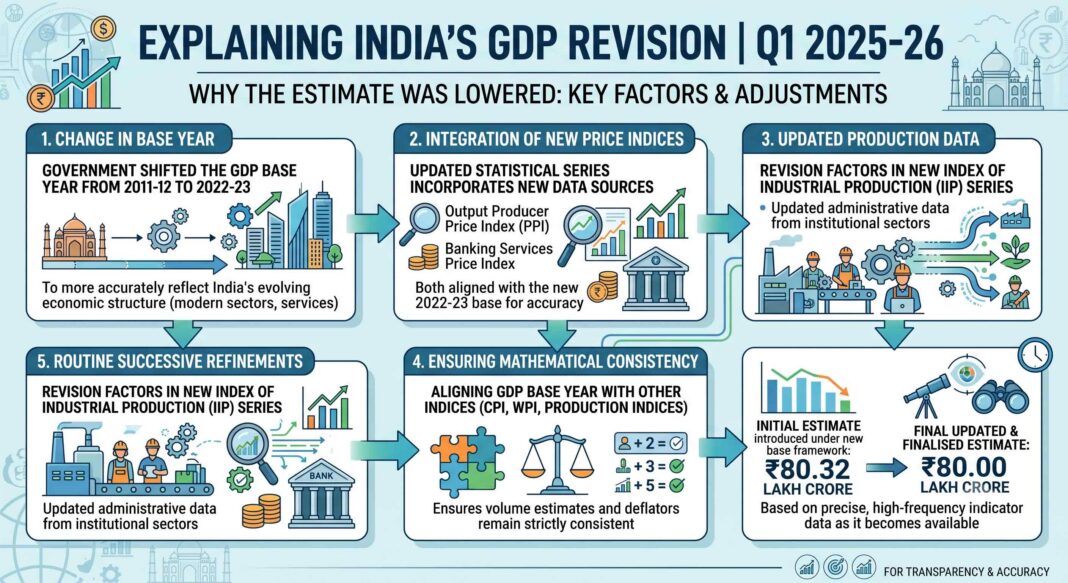
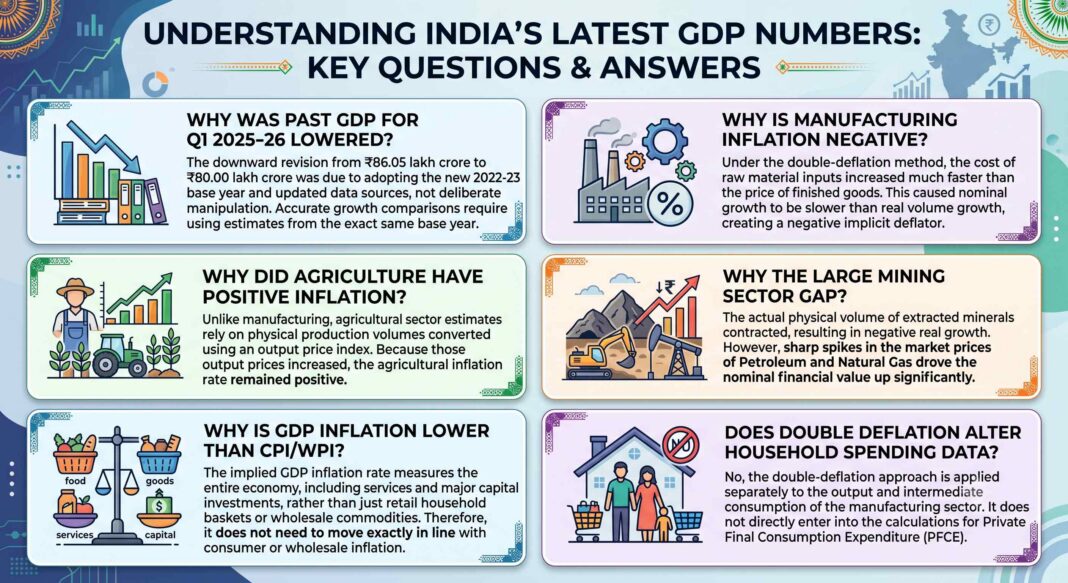
One of the loudest criticisms raised by the opposition was regarding a downward revision of last year’s GDP numbers. Initially, the GDP for the first quarter of last year (2025-26) was reported as ₹86.05 lakh crore under the old 2011-12 base year. However, in the recent reports, this baseline figure was shown as ₹80.00 lakh crore.
Critics, including a former finance secretary, argued that the government purposely shrank last year’s GDP figure by ₹6 lakh crore so that the current year’s figure of ₹88.27 lakh crore would look like a massive jump, thereby ‘artificially manufacturing’ a 7.8% growth narrative.
The Congress also picked up the claim to attack the government. In a post on X, the party alleged that the Modi government had “fudged GDP figures” and claimed that, without the alleged manipulation, real GDP growth would have been only 2.6%.
But this comparison is misleading because the 2.6% figure being circulated is not an alternative calculation of India’s real GDP growth. It comes from comparing figures from two different GDP series.
The government’s clarification: Comparing apples to apples
The Centre issued FAQs amid opposition’s questions over 7.8% GDP growth, emphatically denying the allegation of manipulating numbers. The Ministry of Statistics & Programme Implementation explained that this revision was not a deliberate manipulation but a necessary mathematical adjustment resulting from the shift to the new 2022-23 base year.
When the base year changes, the baseline prices used to value the entire economy change. Furthermore, the new calculation series incorporated vastly improved data sources, such as the new Output Producer Price Index (PPI) and the Banking Services Price Index. Because of this updated methodology, the actual measured size of the economy in Q1 2025-26 under the new framework was recalculated to ₹80.32 lakh crore, which was later finalised to ₹80.00 lakh crore as more accurate indicator data rolled in.
The government stressed that one simply cannot compare ₹86.05 lakh crore calculated with 2011 prices and old methodologies against ₹88.27 lakh crore calculated with 2022 prices and new methodologies. To measure true growth, 2025-26 figures must be recalculated using the new methods so that it can be properly compared with the 2026-27 numbers. When compared fairly under the exact same methodological umbrella, the real GDP growth stands robustly at 7.8%.
The Puzzle of the Manufacturing Sector
How Can Inflation be Negative When Prices are Rising?
Perhaps the most complex point of debate was the manufacturing sector. In the latest numbers, the manufacturing sector recorded a negative inflation rate in its GVA implicit deflator of “-1.5%”.
To the average person, this sounds absurd. If the cost of raw materials like steel, plastic, and energy is going up, and the price of finished goods like cars, appliances, and clothes is also going up, how can the government claim that manufacturing inflation is negative? Critics quickly pointed to this as proof that the data was flawed.
What is “Double Deflation”?
To answer this, the government explained a concept called “Double Deflation”. It sounds intimidating, but let us break it down.
In the past, statisticians would calculate the inflation of the final output and simply assume that the raw materials experienced the exact same rate of inflation. As a result, they used a single deflator. However, in reality, input prices and output prices often move at completely different speeds.
Double deflation is a more advanced, highly accurate method recommended globally by the International Monetary Fund (IMF). Under this method, output (finished goods) and inputs (raw materials) are deflated separately using their respective price indexes.
Here is exactly how the “-1.5%” deflator happened:
During the April-June 2026 quarter, the prices of inputs (what factories buy) rose much faster than the prices of outputs (what factories sell). Imagine a scenario where the cost of raw cotton shoots up by 15%, but a textile factory can only increase the price of a finished shirt by 5% because of market conditions.
Because the input costs rose so aggressively, the nominal GVA (the unadjusted profit margin, essentially) grew slower—at 7.7%—than the real GVA (the physical volume of value added), which grew at 9.2%. The resulting difference between nominal and real GVA growth produced a negative implicit GVA deflator of 1.5%. Mathematically, when Real Growth outpaces Nominal Growth, the formula gives a negative deflator.
Thus, a -1.5% deflator does not mean manufacturing prices dropped; it merely reflects the harsh reality that input prices squeezed the producers far more than output prices rose. The government noted that this trend was heavily seen in sectors like basic metals, rubber, plastics, and textiles.
Importantly, a negative GVA deflator does not mechanically imply lower real growth. It also does not imply that manufacturing output prices declined. It reflects the relative movement of output and input prices in the double-deflation framework. Real GVA growth depends on the relative movements in real output and real intermediate consumption.
Reconciling the 2.5% Implied GDP Inflation Rate with CPI and WPI
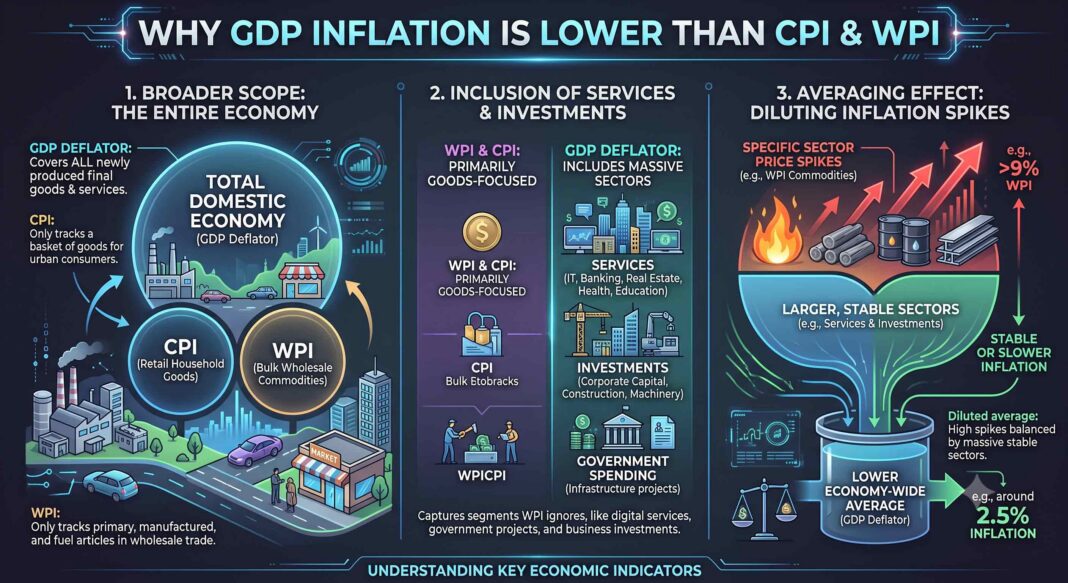
When the government announced an implied GDP inflation rate, called the GDP deflator, of just 2.5%, many observers were left scratching their heads. How could this be accurate when everyday retail inflation measured by the Consumer Price Index (CPI) was at 3.9%, and wholesale inflation measured by the Wholesale Price Index (WPI) had crossed a massive 9%?
To understand this, we must look at exactly what these three inflation metrics measure, as they cover entirely different parts of the economy.
Understanding CPI, WPI and GDP Deflator
- Consumer Price Index (CPI): This is the inflation everyone feels every day. It tracks a very specific “basket” of items that common households buy, such as food, clothing, housing, and transport. If the price of vegetables or retail milk spikes, the CPI goes up.
- Wholesale Price Index (WPI): This tracks the prices that businesses and factories pay for bulk goods and raw materials before they reach the retail consumer. It is heavily influenced by global commodity prices, fuel, and manufactured goods. Importantly, WPI completely ignores the “services” sector like IT, banking, and education.
- Implied GDP Inflation Rate (GDP Deflator): This is the ultimate, all-encompassing measure of inflation for the entire country. Unlike CPI or WPI, it does not just look at household groceries or factory raw materials. The government clarified that the GDP deflator covers the broader economy, which includes personal consumption, corporate investments, government spending like building infrastructure, exports, and the massive services sector.
Why the numbers do not need to match
Because the GDP deflator covers a much wider footprint of the economy, including massive areas completely untouched by CPI and WPI, the government has explicitly stated that the implied GDP inflation rate “need not move in line with either CPI or WPI”.
For instance, while WPI was pushed over 9% due to a sharp rise in specific raw materials such as crude petroleum and metal ores, these industrial inputs only make up a fraction of the total economy. At the same time, large segments of the economy, like broad services, long-term capital investments, and government expenditure, may not have experienced that same severe price jump.
When the average inflation across the entire GDP pie is calculated, the severe spikes in wholesale goods are diluted by the relative stability in other sectors, resulting in the broader 2.5% implied GDP inflation rate.
In simple terms: The 2.5% figure is a blended average for the whole country’s total output, while the 3.9% CPI is specific to the household shopping basket, and the 9% WPI is specific to factory inputs. Because they are measuring three entirely different things, it is mathematically normal for the numbers to be different.
Why double deflation doesn’t affect household budget
The adoption of the “double deflation” method caused some critics to worry if it artificially altered household consumption figures, known technically as Private Final Consumption Expenditure (PFCE). If factory math is changing, does that mean the government is changing how they calculate our spending?
The government has firmly stated: No. Double deflation is strictly a production-side tool used exclusively to calculate industry GVA. It applies to factories and businesses to accurately measure the value they add. When the government calculates how much households are spending (PFCE), they use completely different, consumer-centric data sets. As PFCE is a measure of final demand (expenditure on goods and services for final use), it has no intermediate consumption to subtract, like in case of industries. Therefore, the mathematical anomalies seen in the manufacturing sector’s inputs and outputs have zero artificial impact on how household consumption is recorded and presented in the final GDP figures.
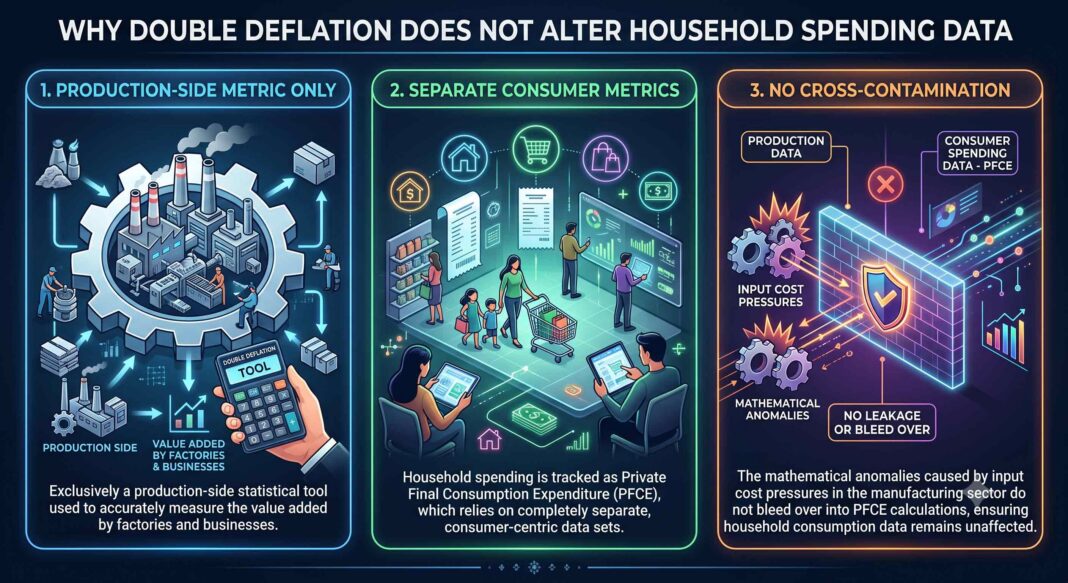
At the quarterly level, PFCE is estimated at a detailed item/item-group level. For various goods such as food and manufactured products, constant-price estimates are compiled first using appropriate volume indicators, and current-price estimates are subsequently derived using relevant Consumer Price Indices. For several services items under PFCE, such as education, health, restaurants and accommodation services, current-price estimates are compiled using relevant output indicators and the corresponding constant-price estimates are derived using appropriate price indices.
Therefore, double deflation is relevant to the estimation of production-side GVA and is not a method used directly for estimating PFCE.
Why agriculture and mining showed different trends
Another question after the GDP numbers were announced was: if manufacturing showed a negative deflator, why did other sectors behave differently?
The positive inflation in agriculture
For the agricultural sector, the GVA implicit deflator showed a positive inflation rate of 3.9%. The government explained in its detailed FAQ releases that agriculture is calculated using a completely different methodology than manufacturing.
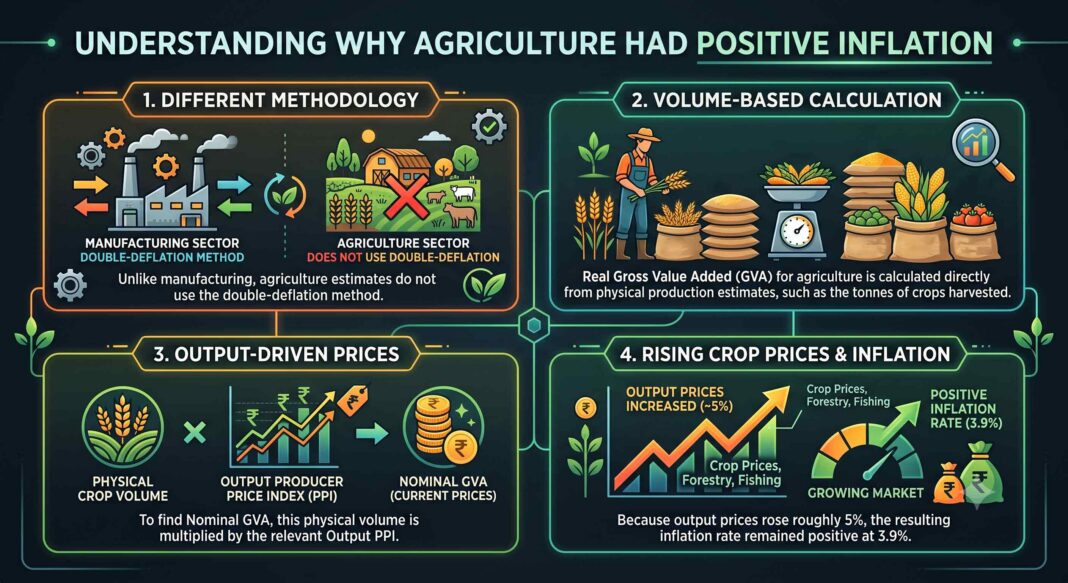
Agricultural Real GVA is first calculated based on physical production estimates, how many tonnes of wheat, rice, pulses etc., were actually harvested. Once the physical volume is known, it is multiplied by the relevant Producer Price Index (PPI) to get the current Nominal GVA. In Q1 2026-27, the output PPI for agriculture, forestry, and fishing rose by roughly 5%. Because agricultural nominal GVA is tied directly to these final output prices, its implied inflation stayed in positive territory at 3.9%.
Gap between nominal GVA and real GVA estimates of mining sector
Critics also pointed out discrepancies in the mining sector, citing a large gap between nominal and real estimates. But the government has clarified that this is the result of high Inflation based on PPI in the sector.
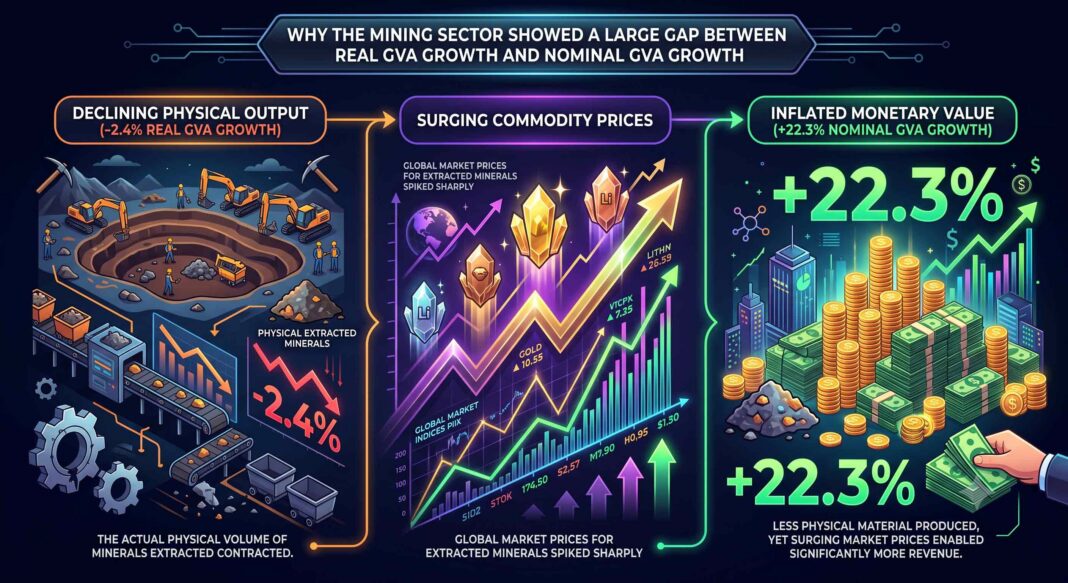
The nominal estimates are derived by applying the relevant Producer Price Indices (PPI) to the corresponding real estimates for different mineral groups. The PPI data for Q1 2026-27 indicate significant price increases in the Mining & Quarrying sector. In particular, prices of Crude Petroleum and Natural Gas increased by 69.5% in April, 72.2% in May and 33.7% in June, while Mining of Metal Ores recorded inflation of 27.6%, 25.2% and 23.5%, respectively. The nominal GVA growth of the Mining & Quarrying sector accordingly stood at 22.3% in Q1 2026-27.
On the other hand, the real GVA growth for Mining & Quarrying was -2.4% during Q1 2026-27. This perfectly aligns with the high-frequency Index of Industrial Production (IIP) data, which showed negative growth in April (-3.8%) and May (-1.4%), dragging down the overall quarterly average despite a slight recovery (1.6%) in June. The data was consistent across different government tracking tools, leaving no room for statistical discrepancy.
Therefore, the substantial difference between real and nominal GVA growth is primarily a result of the strong increase in mineral prices, particularly crude petroleum and natural gas and metal ores. In simple terms, the difference is the result of a sharp increase in prices and a slight decrease in production volume.
Conclusion: Trusting the process
The debate surrounding the 7.8% GDP growth rate for Q1 2026-27 is a perfect example of how complex economics can become tangled with political narratives. To a layperson, seeing past data revised downward or seeing a negative inflation figure for a sector where costs are rising can understandably look highly suspicious.
However, as the detailed FAQs issued by the Ministry of Statistics and Programme Implementation illustrate, these numbers are not the result of random manipulation or a desire to artificially inflate current growth. They are the outcome of adopting more rigorous, globally accepted statistical standards. Updating the base year to 2022-23 and implementing the double deflation method brings India’s statistical tracking in line with recommendations from international bodies like the IMF.
While it may require a bit of patience to look past the dense jargon, understanding these concepts is vital for every citizen. The revision of past data was an apples-to-apples normalisation process, not a deliberate downgrade. The peculiar manufacturing numbers merely showed that businesses faced severe input cost pressures that outpaced their ability to raise final prices.
Ultimately, robust methodologies ensure that policymakers, businesses, and everyday citizens have the truest possible picture of the Indian economy. The extensive breakdown provided by the government confirms that the 7.8% real GDP growth is built on solid, transparent statistical foundations.