
Congress’ “reinvigorated” social media presence, and Rahul Gandhi’s “coming of age” on social media, have been under scrutiny lately. From campaigns which have backfired, frequent goof ups, to Rahul using bots as virtual steroids to boost his social media influence, we have seen it all. Or have we.
On the anniversary of demonetization, Congress launched a barrage of data from its social media handle, to claim demonetization was a failure. In many cases, the “data” was iffy.
For example, let us see the following tweet:
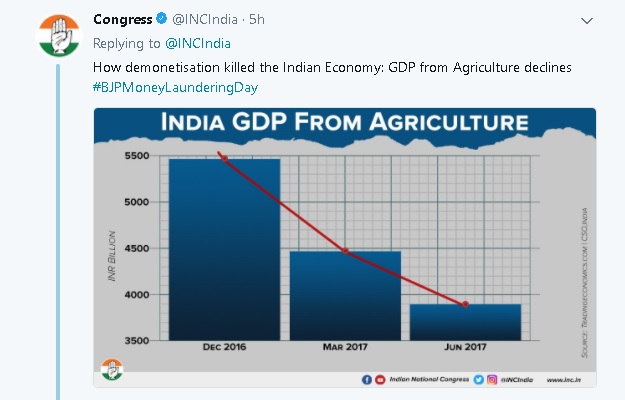
Looking at the above tweet, one would readily assume that yes, India’s GDP from agriculture fell off a cliff since Dec 2016 quarter, which is the Demonetization quarter. Thus Demonetization hurt agriculture. But, if we see the same data for the past 3 years, the trend is very similar:
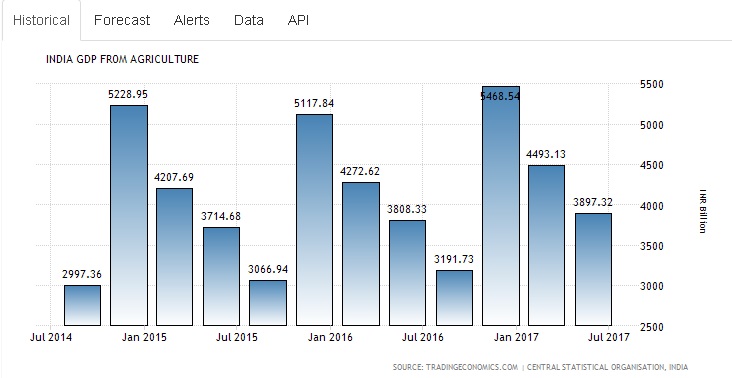
Did we have a demonetization exercise every year? No. This trend in Agri GDP, which is seen annually, is simply down to the fact that Agri GDP is seasonal is nature. An increase in output after the harvest season following the June-September monsoons, always leads to higher Agri GDP in the subsequent quarter.
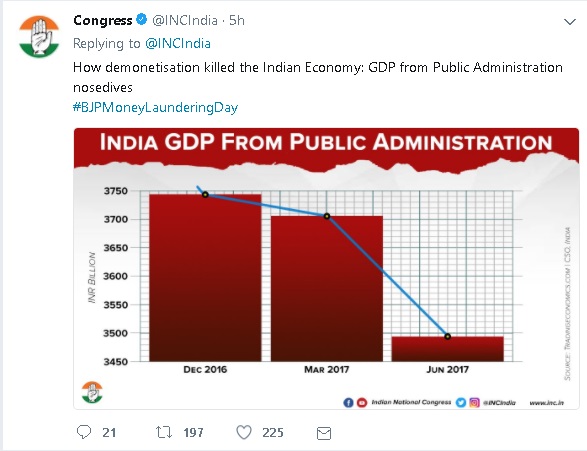
Next, a chart tells us that GDP from Public Administration has collapsed. Congress claims that even though Demonetization was during the December quarter, the “massive” fall happened in the June quarter.
Again, the same data, if seen for a longer horizon, say from 2011-12 onward, shows a different picture:
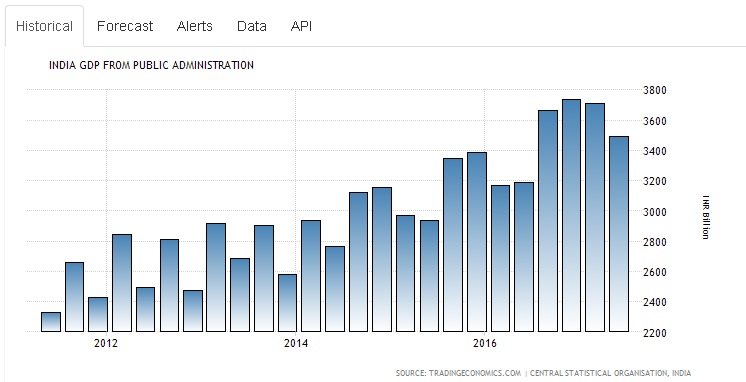
Once you see the above 2 charts, its clear, that Congress has cherry-picked data from the last 3 bars, zoomed in, and shown us only those 3 bars. Further, the Congress has done some clever charting to show the massive fall from March quarter to June quarter. As one can see from the longer horizon chart, even this low GDP from June quarter, is far more than anything UPA achieved since 2011-2012. And it also is NDA’s 4th best performance out of all the quarters it was in power. Not so bad now is it?
Next, Congress talks about the Consumer Price Index:
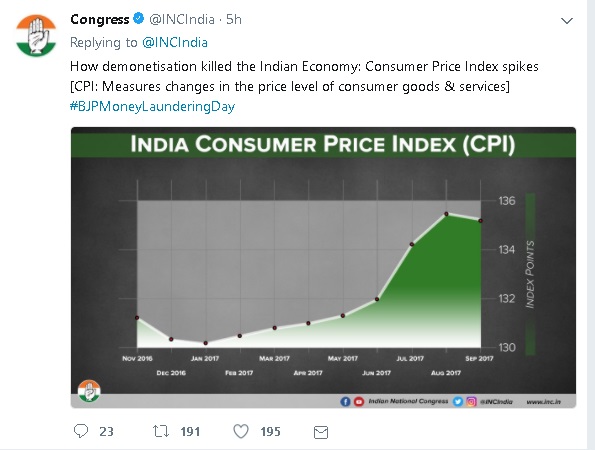
Once again, a longer horizon shows the CPI rising every quarter:
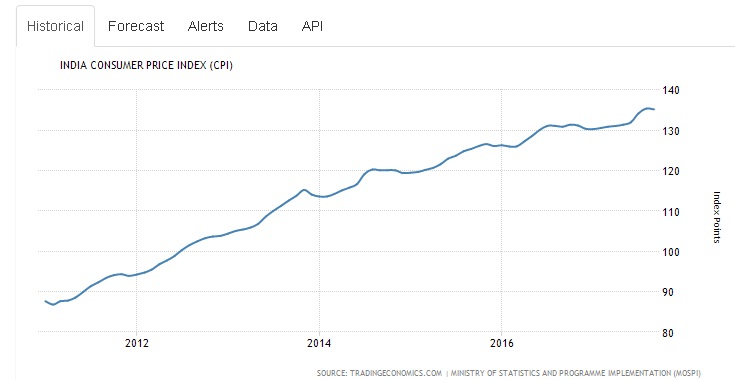
But that is not the point here. Here, the Congress has used the CPI to show a rise, whereas economists normally compare the rate of change of CPI i.e. Inflation. Egs: We often read that Inflation has “slowed down” to around 3% or 4%. This means inflation exists (i.e. the CPI is increasing), but inflation is much lower (i.e. CPI is increasing slowly), i.e. Prices are rising much slower.
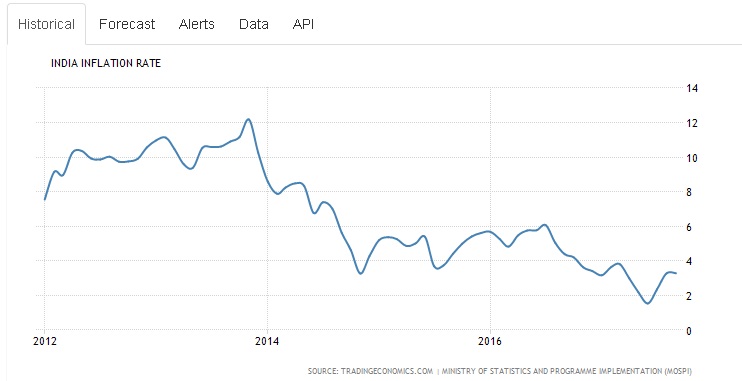
Thus, when we see the Inflation rate (as against the CPI), we realise that since 2014, India’s inflation has cooled down significantly:
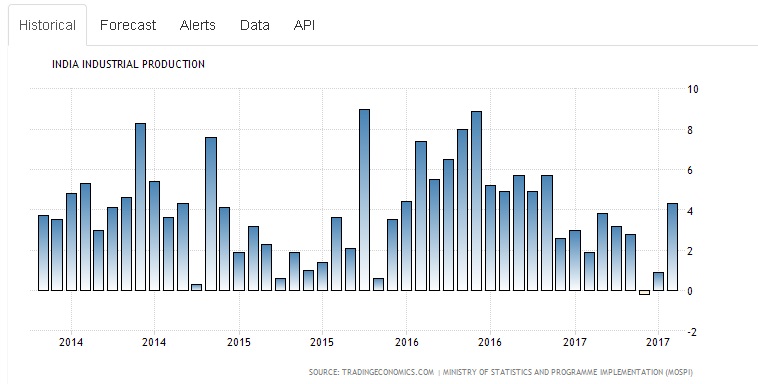
The next chart used by Congress is on India’s industrial production:
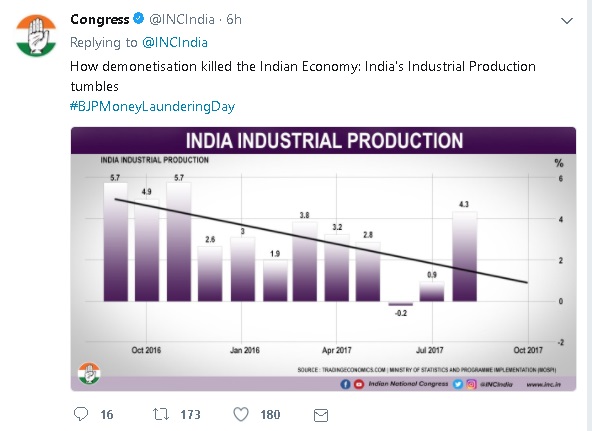
Firstly, a sloping line drawn even when August IIP is a robust 4.3 is ridiculous. Secondly, the fall in IIP actually coincides with GST implementation i.e. June 2017, when most companies had destocked, in anticipation of the regime change. Nothing to do with demonetization. If there was a demonetization impact, it would have shown much earlier, and there would not have been the revival we see in August 2017 i.e. when GST broadly settled. Further, a longer horizon view again exposes Congress:
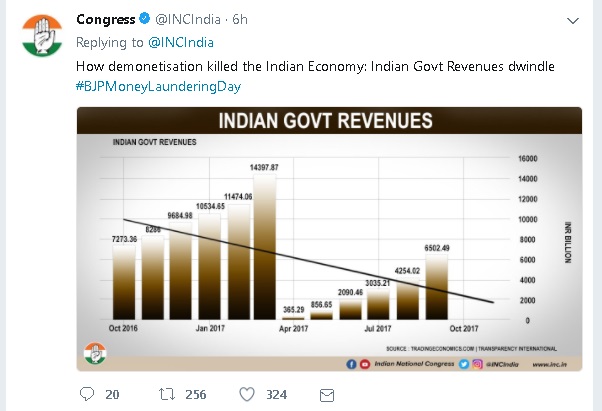
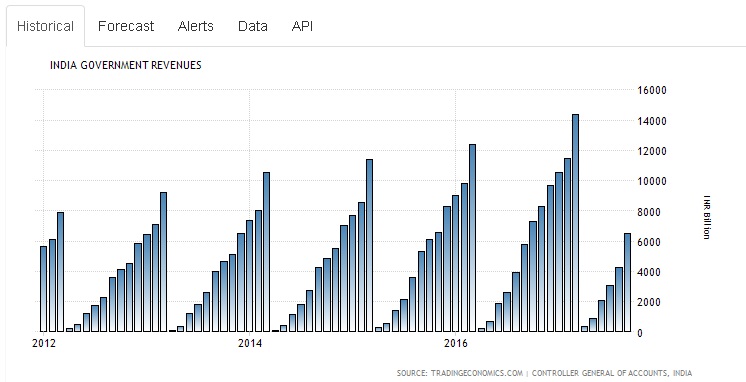
Another example of retarded logic by showing cherry picked data is how Indian government revenues are portrayed using Year-to-Date data, without showing earlier years:
The above chart, if taken for any of the last 5 years will show the exact same trends, did we have demonetization all these years?
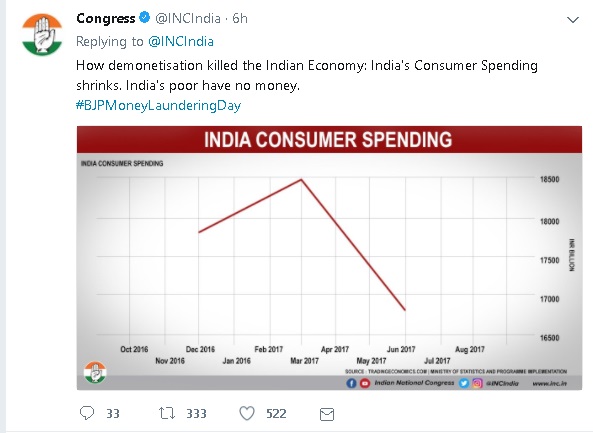
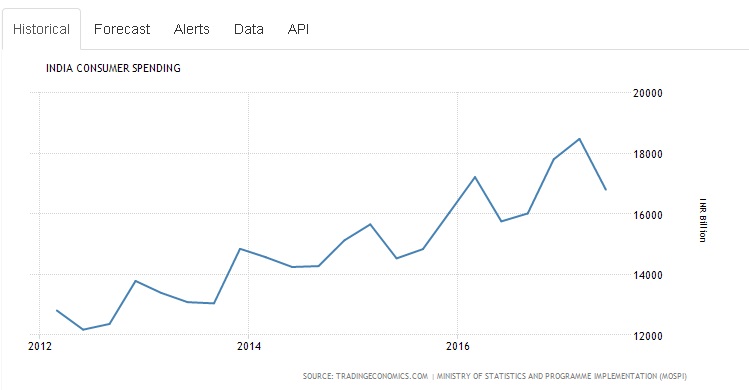
Lastly, see how Congress claims “demonetization killed the Indian Economy: India’s Consumer Spending shrinks. India’s poor have no money”. Although the supply of cash was strained in November, December and in January, “India’s poor had no money” only from April, May and June, as per Congress.
The same data, plotted for 5 years, shows that due to the seasonal nature of demand in India, every single year “India’s poor” have a shortage of money around the same time, thus causing a fall in consumer spending.
One wrong analysis could have been a mistake, two could have been coincidence, but when Congress has repeatedly committed the same “errors” in analysing economic data, it only points to one thing: Congress believes Indians are naive fools who can be fed cherry-picked data, padded up just to suit a narrative.
Now for the fun part, scroll up and see the source of every chart the Congress has put up, and the source of the other charts as well. All the charts, Congress’ as well as those which expose Congress, come from the same source: tradingeconomics.com, thus eliminating the argument that the data could be different. And also reinforcing the fact that Congress has dishonestly put out half truths and whole lies. Or maybe these charts were vetted by the great economist ex-PM?
